

Charts
Visual information as charts, dashboards, or tables is easier and faster for people to consume and they offer a nice break from endless words.
Visio Process Flow Charts

In creating a process flow chart as an illustrational overview in an SOP or WI, it is important to arrange the steps and lines in away that is easy to follow and can be clearly read on a normal 8.5 x 11 in piece of paper. Sometimes this means simplifying steps or breaking up large processes into smaller pieces. A flow chart’s usefulness as tool diminishes if it is illegible or confusing to follow.

Tableau Dashboard
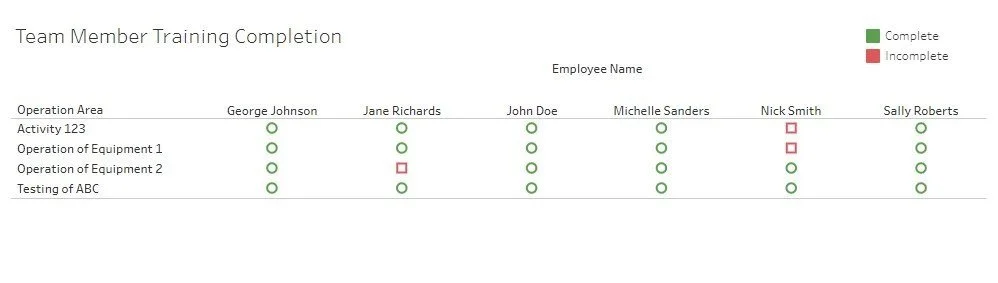
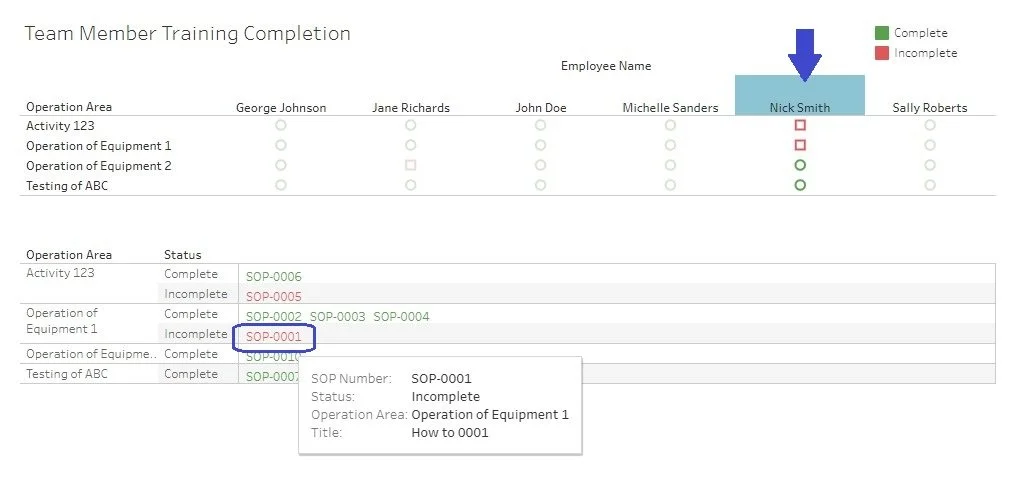
Tableau is a powerful visualization tool that can be used to create impressive visualizations for use as either as a one off presentation of a data set or as a connected real time dashboard with integrated links to data sets in other systems or cloud locations. I used Tableau to create a tool that transformed specifically selected training completion information from the learning management system report data to a dashboard. This visualization helped turn a spreadsheet full of data into a easy to digest visual showing which team members were cleared to execute specific operations that day. By incorporating action filters and tool tips this dashboard can be used to drill into more individual details as needed.